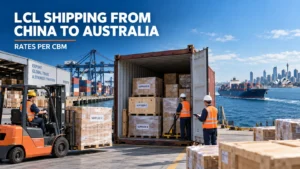
China to USA ocean freight rates in 2026 remain highly volatile, with transpacific spot pricing changing quickly in response to strong import volumes, carrier capacity management, blank sailings, fuel costs and changing trade conditions.
For importers planning shipments from Shanghai, Ningbo, Shenzhen, Yantian, Qingdao or other major Chinese ports to the United States, the most important point in August is that freight rates should not be treated as a fixed annual price.
Rates may change from one sailing to the next.
As of mid-August 2026, major freight indices showed renewed strength on the transpacific trade.
Drewry reported on August 13 that its World Container Index increased to $4,339 per 40ft container, driven partly by higher transpacific freight rates. On the same assessment, the Shanghai–Los Angeles benchmark increased to approximately $6,244 per 40ft container, while Shanghai–New York increased to approximately $8,706 per 40ft container.
These figures are market benchmarks rather than guaranteed BRF SHIPPING booking quotations.
Actual China to USA 40HQ rates depend on:
- Chinese origin port
- U.S. destination port
- Shipping line
- Container type
- Cargo-ready date
- Direct or transshipment service
- Space availability
- Equipment availability
- Contract or spot pricing
- Destination delivery requirements
Importers should therefore confirm live rates before booking.
Looking for a complete guide to ocean shipping instead of the latest market rate update?
For FCL, LCL, ports, transit times, customs, container types and door delivery, see our complete evergreen guide: Sea Freight from China to USA.
August 2026 China to USA Ocean Freight Rate Snapshot
The following market indicators provide a useful reference for understanding current China USA freight rate trends.
| Trade Lane | Mid-August 2026 Market Benchmark | Equipment |
|---|---|---|
| Shanghai → Los Angeles | Approx. $6,244 | 40ft container |
| Shanghai → New York | Approx. $8,706 | 40ft container |
| Drewry World Container Index | $4,339 | 40ft container |
The Shanghai–Los Angeles benchmark increased approximately 6% during the August 13 assessment week, while Shanghai–New York increased approximately 10%.
Important: These are freight-market index benchmarks, not door-to-door quotations and not guaranteed 40HQ booking rates.
They generally do not include all possible:
- China pickup charges
- Export customs costs
- Origin terminal charges
- Destination charges
- U.S. customs brokerage
- Import duties
- Exam charges
- Demurrage or detention
- Port storage
- Chassis costs
- Rail transportation
- Final truck delivery
For an actual shipment, BRF SHIPPING recommends comparing the total landed logistics cost, not only the ocean freight number.
China to USA 40HQ Rates in August 2026
The 40HQ container is one of the most frequently requested equipment types for China-to-USA commercial freight.
It is widely used for:
- Furniture
- Aluminum products
- Fencing
- Building materials
- Consumer goods
- Packaging
- Machinery
- E-commerce inventory
- Industrial products
- High-volume lightweight cargo
However, there is no single nationwide China to USA 40HQ rate.
A Shanghai-to-Los Angeles container and a Qingdao-to-Savannah container can have very different pricing.
Even two 40HQ containers departing from the same Chinese port may receive different rates if they use different carriers or sailing dates.
Main factors affecting China to USA 40HQ rates
Origin Port
Shanghai, Ningbo, Shenzhen/Yantian, Qingdao, Xiamen and Tianjin may all have different carrier capacity and pricing.
Destination Port
US West Coast, Gulf Coast and East Coast services have different voyage distances, capacity structures and market conditions.
Shipping Line
COSCO, CMA CGM, MSC, ONE, Maersk, Evergreen and other carriers may offer different rates and routing options.
Cargo-Ready Date
A quotation valid this week may not remain valid for the next sailing.
Equipment Availability
40HQ shortages at individual depots can affect booking options.
Blank Sailings
Cancelled sailings reduce available weekly capacity and can create temporary space pressure.
US West Coast Freight Rates – August 2026
The US West Coast remains one of the most important gateways for cargo shipped from China.
Major destinations include:
- Los Angeles
- Long Beach
- Oakland
- Seattle
- Tacoma
For many Chinese exporters, Los Angeles and Long Beach provide relatively fast access to Southern California and major inland rail networks.
The August 13 Drewry assessment placed the Shanghai-to-Los Angeles 40ft benchmark at approximately $6,244, up 6% from the previous assessment.
This makes US West Coast freight rates one of the key indicators importers should monitor during the 2026 peak shipping season.
Import demand also remains significant.
The Port of Los Angeles handled approximately 960,464 TEUs in July 2026, its second-highest July volume, including nearly 500,000 TEUs of imports. The strong traffic was associated with an early peak season and importers advancing cargo amid changing trade conditions.
For importers using Southern California gateways, see the BRF SHIPPING Port of Los Angeles logistics guide for information about terminals, customs, rail and inland transportation.
China to US East Coast Freight Rates
The US East Coast generally requires a longer ocean routing than the West Coast and may therefore carry a higher ocean freight cost.
Major gateways include:
- New York / New Jersey
- Savannah
- Charleston
- Norfolk
- Baltimore
- Miami
In Drewry’s August 13 assessment, the Shanghai-to-New York benchmark increased to approximately $8,706 per 40ft container, a 10% weekly increase.
This does not mean every China-to-New-York shipment costs exactly $8,706.
Actual quotations can differ according to:
- Origin port
- Carrier
- Sailing date
- Equipment
- Service contract
- Space allocation
- Destination charges
Importers shipping to Eastern or Southeastern U.S. destinations should also compare East Coast port delivery against West Coast plus rail or truck transportation.
The cheapest port-to-port freight rate is not always the cheapest total logistics solution.
Why Are Transpacific Freight Rates Moving in August 2026?
Several market forces are influencing transpacific freight rates.
1. Strong Import Volumes
Major U.S. gateways have continued handling large import volumes.
The Port of Los Angeles reported particularly strong July 2026 activity, supporting continued demand for Asia-to-USA container capacity.
2. Blank Sailings and Capacity Management
Shipping lines can remove capacity by cancelling scheduled sailings.
Drewry reported that carriers were actively restricting transpacific capacity through blank sailings. Its August 13 market assessment noted 10 cancelled sailings in each of the previous two weeks and another seven cancellations planned for the following week.
When available vessel space falls while cargo demand remains strong, freight prices may increase quickly.
3. Peak-Season Shipping Demand
Many U.S. importers move:
- Holiday inventory
- Retail merchandise
- Furniture
- Consumer electronics
- Building materials
- Commercial inventory
before the traditional autumn and year-end sales season.
In 2026, some cargo has been moved earlier than usual, increasing short-term demand for container space.
4. Trade Policy Uncertainty
Changes in tariff expectations can influence importer behavior.
When companies expect potential changes in landed costs, some importers advance purchase orders and shipping schedules.
This can create short periods of unusually strong demand.
5. Global Shipping Disruptions
Ocean freight pricing is not determined only by China–USA cargo demand.
Port congestion, vessel schedules, fuel costs, geopolitical disruptions and changes elsewhere in the global carrier network can affect available capacity and operating costs.
For this reason, transpacific freight rates can move significantly within a short period.
Shanghai to USA Freight Rate Update
Shanghai remains one of the most important container export gateways in China.
Major USA services connect Shanghai with:
- Los Angeles
- Long Beach
- Oakland
- Seattle / Tacoma
- Houston
- Savannah
- New York / New Jersey
- Norfolk
- Charleston
The Shanghai–Los Angeles and Shanghai–New York benchmarks are therefore useful reference points for monitoring the broader China–USA freight market.
However, they should not automatically be used for shipments originating from another Chinese port.
Ningbo to USA Freight Rate Update
Ningbo-Zhoushan is an important gateway for factories located throughout Zhejiang and nearby manufacturing regions.
Common cargo origins include:
- Ningbo
- Yiwu
- Hangzhou
- Shaoxing
- Taizhou
- Jinhua
Ningbo can sometimes provide competitive alternatives to Shanghai depending on:
- Factory location
- Carrier service
- Vessel schedule
- Container equipment
- Space availability
BRF SHIPPING can compare Shanghai and Ningbo options when the supplier location makes both ports practical.
Shenzhen / Yantian to USA Freight Rates
Shenzhen and Yantian are key export gateways for South China.
They serve manufacturing regions including:
- Shenzhen
- Dongguan
- Guangzhou
- Foshan
- Huizhou
Yantian has extensive transpacific container connections and is particularly important for cargo moving to the U.S. West Coast.
For South China exporters, comparing:
Yantian → Los Angeles / Long Beach
against alternative South China services can help balance freight cost and transit time.
Qingdao to USA Ocean Freight Rates
Qingdao is one of the major container ports serving northern China.
It is especially convenient for factories in:
- Qingdao
- Weifang
- Zibo
- Linyi
- Jinan
- Yantai
- Shandong Province
BRF SHIPPING is headquartered in Qingdao and can arrange:
Factory pickup → warehouse → container loading → export customs → ocean freight → U.S. customs coordination → truck delivery.
Available USA routing can include West Coast, Gulf Coast and East Coast gateways depending on carrier schedules.
Port-to-Port Rate vs Door-to-Door Shipping Cost
A common mistake is to compare freight forwarders using only the ocean freight rate.
For example:
Ocean Freight
is only one component of:
China Factory → U.S. Final Destination
A full shipment may include:
China factory pickup
↓
Warehouse or container loading
↓
Export customs declaration
↓
Chinese terminal
↓
Ocean freight
↓
U.S. terminal
↓
Customs clearance
↓
Port or rail pickup
↓
Truck delivery
↓
Warehouse / business / project site
For some shipments, a slightly higher ocean rate can produce a lower total cost if it reduces:
- Inland rail
- Truck mileage
- Terminal handling
- Transloading
- Storage
- Delivery time
BRF SHIPPING therefore evaluates the complete transportation route rather than ocean freight alone.
What Importers Should Do in Late August 2026
With China to USA ocean freight rates remaining volatile, importers should avoid assuming that a quotation will remain available indefinitely.
1. Request Rates Close to Cargo-Ready Date
Provide the actual cargo-ready date rather than requesting a theoretical price months in advance.
2. Compare Multiple Carriers
The cheapest carrier may not always provide the best combination of:
- Space
- Schedule
- Transit time
- Free time
- Destination cost
3. Book Earlier During Tight Capacity
Blank sailings can quickly reduce available space.
If delivery timing is important, allow enough time before the required ETD.
4. Compare US Gateways
For inland destinations such as:
- Dallas
- Chicago
- Denver
- Atlanta
- Phoenix
compare different port and inland-routing combinations.
5. Check 40HQ Equipment Availability
For large-volume shipments, confirm equipment before finalizing factory loading dates.
China USA Freight Rate Outlook for September 2026
The market entering September should be treated as volatile rather than permanently high or permanently low.
Mid-August data shows renewed transpacific rate strength, while carriers continue adjusting capacity through blank sailings.
Rates can still change quickly depending on:
- Peak-season demand
- Carrier GRIs
- Blank sailings
- Fuel costs
- Port congestion
- Trade policy
- Available capacity
Importers should therefore avoid making purchasing or selling decisions based on a single published rate.
A live quotation based on the actual cargo-ready date remains the most reliable method.
Evergreen China to USA Shipping Guide
This page is designed specifically as an August 2026 China USA freight rate update.
It does not attempt to duplicate BRF SHIPPING’s complete ocean freight guide.
For detailed information about:
- FCL shipping
- LCL shipping
- 20GP containers
- 40GP containers
- 40HQ containers
- Major Chinese ports
- Major U.S. ports
- Transit times
- Customs
- ISF / AMS
- Door delivery
- Shipping process
read:
That page is BRF SHIPPING’s evergreen China-to-USA sea freight guide, while this page is updated to track current market conditions and ocean freight rates.
Get Current China to USA 40HQ Rates
Published market indices are useful for understanding the direction of freight prices, but they are not booking quotations.
For a current BRF SHIPPING rate, send:
- Chinese pickup city
- Chinese loading port, if known
- U.S. port or delivery ZIP code
- Cargo description
- HS code, if available
- Total weight
- Total CBM
- Container type: 20GP / 40GP / 40HQ
- Cargo-ready date
- Incoterm: EXW / FOB / FCA / other
- Port-to-port or door delivery requirement
BRF SHIPPING can compare available routing, carrier schedules and current container pricing.
Email: Quotation@brfshippinggroup.com
WhatsApp: +86 138 6982 0502
China to USA Ocean Freight Rates FAQ
What are China to USA ocean freight rates in August 2026?
Rates vary by origin, destination, carrier and sailing date. As a market benchmark, Drewry’s August 13 assessment placed Shanghai–Los Angeles at approximately $6,244 and Shanghai–New York at approximately $8,706 per 40ft container.
These are market reference figures rather than guaranteed booking rates.
How much does a 40HQ cost from China to USA?
There is no single fixed China to USA 40HQ rate.
The price depends on origin port, U.S. port, carrier, cargo-ready date, space availability and other market conditions.
Contact BRF SHIPPING with your origin and destination for a current 40HQ quotation.
Are US West Coast freight rates increasing?
In the August 13 Drewry assessment, Shanghai-to-Los Angeles increased approximately 6% to around $6,244 per 40ft container.
However, ocean freight markets can change rapidly, so future increases are not guaranteed.
Why are transpacific freight rates volatile?
Major factors include cargo demand, blank sailings, carrier capacity management, fuel costs, port congestion and changing trade conditions.
Is Los Angeles cheaper than New York for shipping from China?
Port-to-port ocean freight to the U.S. West Coast is often lower than East Coast routing because of the shorter transpacific voyage.
However, the best port depends on the final delivery location.
For an importer in Pennsylvania, Georgia or New York, using an East Coast port may still produce a lower total delivered cost than shipping through Los Angeles and moving the container inland.
Should I book China to USA freight now or wait?
There is no guaranteed method for predicting the lowest future rate.
If cargo is ready and the delivery deadline matters, compare live carrier options and book according to the required schedule rather than relying only on predictions about future freight prices.
How often will BRF SHIPPING update this page?
This page is designed as a market update for China to USA ocean freight rates 2026.
BRF SHIPPING can update freight benchmarks, carrier conditions and booking guidance as the market changes.
For general shipping information that does not depend on monthly market conditions, use the Sea Freight from China to USA evergreen guide.